Real portfolios.
Real results.

Three accounts. Three approaches. All built on TGI ranking scores — applied differently, by different investors, in different life circumstances — with real capital, real buy decisions, and real market conditions. No simulations. No cherry-picked timeframes. No perfection.

⚠️

I am not a financial advisor. These charts represent real portfolios managed using the TGI methodology. They are shared to demonstrate that the strategy works in practice, not to promise similar results for anyone else. Account identifiers have been removed to protect privacy. Past performance does not guarantee future results. Do your own research.

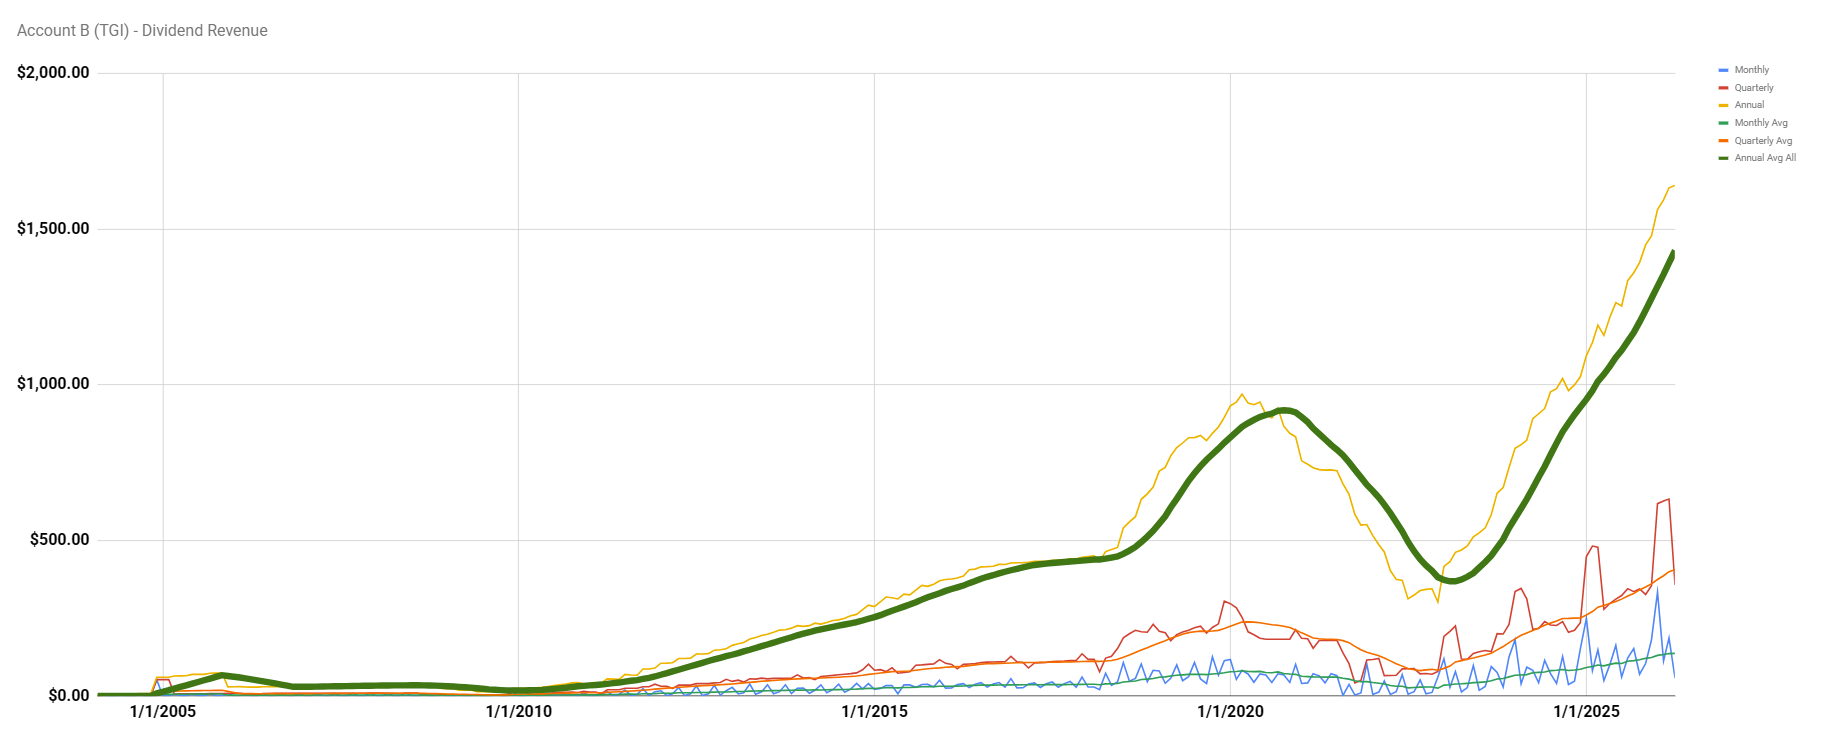
This is the full 25-year journey — including the wrong paths. The early years reflect dart-throwing at stocks in the news. The middle years reflect the high-yield chase. The 2020 reset is visible in the dividend chart as a near-vertical drop. All of it is real, and all of it is the point. The strategy that works today was built by learning what didn't.

Dividend Income — 2000 to Present

Updated May 2026
Peak Annual Income
~$3,200
After TGI Reset (2020)
−90%
Current Trajectory
↑ Climbing
Account A dividend income chart 2000 to 2026 showing high yield peak and TGI reset

The peak around 2019–2020 represents the high-yield strategy at its apex — real income, but built on stocks with unsustainable payouts and stagnant prices. The crash that follows was deliberate. In early 2020, nearly everything was sold and capital was redeployed into top-ranked TGI stocks. Dividend income dropped approximately 90% overnight.

The Annual Average line (green) tells the recovery story. Income is rebuilding on a fundamentally different foundation — dividend growth from companies raising their payouts year over year, not yield-chasing. The current slope is steeper and more durable than the one that preceded the reset.

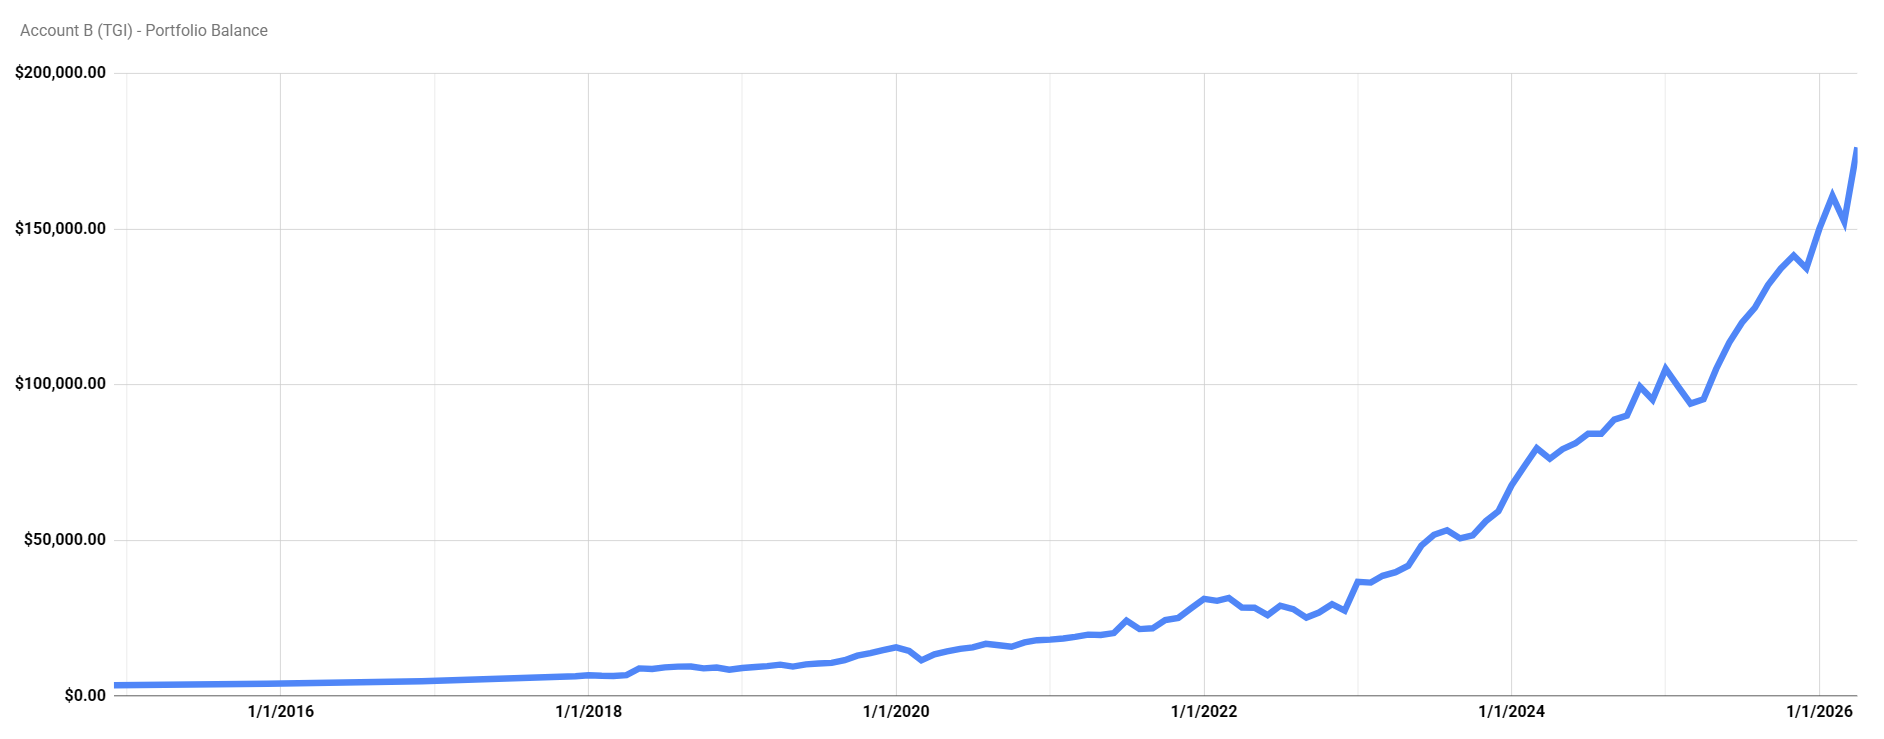
Portfolio Balance — 2018 to Present

Updated May 2026
Balance at Reset (2020)
~$20,000
Current Balance
~$140,000
Growth Since Reset
7× in 5 years
Account A portfolio balance chart 2018 to 2026 showing steady growth

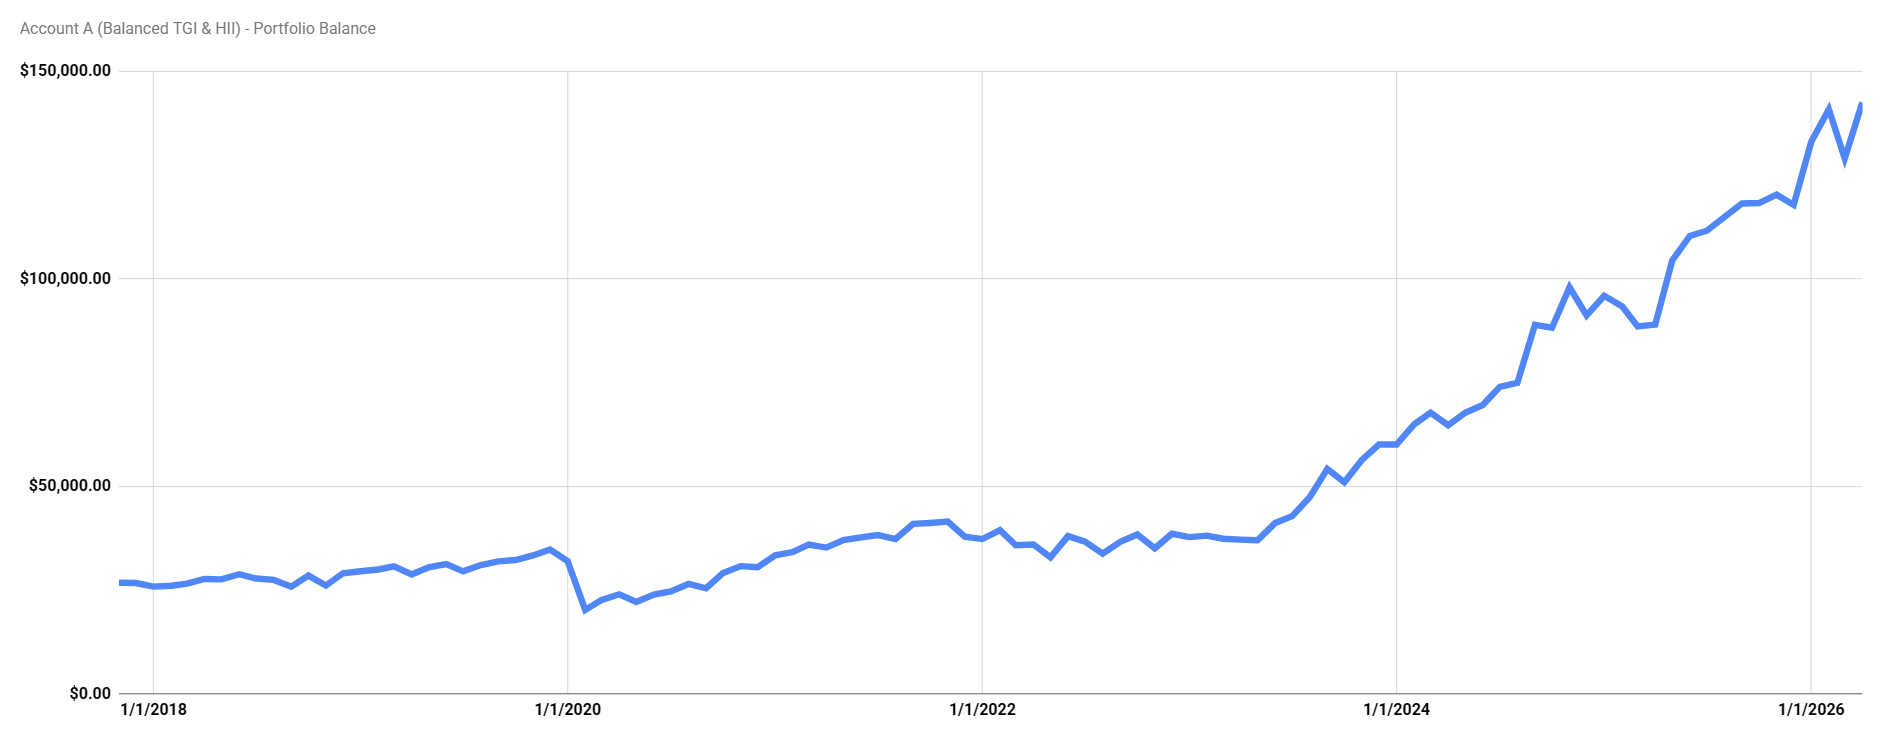
Portfolio value was essentially flat from 2018 through 2022 — the reset period. Capital was redeployed, new contributions were being made, but the compounding hadn't had time to accelerate yet. The inflection point arrives around 2022–2023 and the slope has been steepening since.

The dip in early 2020 is the COVID crash — visible but not catastrophic. The TGI portfolio held through it without panic selling. That steadiness is part of what the strategy is designed to produce.


A second investor, a different starting point. In July 2021, the TGI methodology was applied to this existing portfolio — which meant selling approximately $5,300 worth of bottom-ranked holdings to clean things up before redeploying into top-ranked TGI stocks. The dividend revenue dip around 2021–2022 is that cleanup happening. What followed is four years of compounding that has beaten the previous approach by a wide margin. You don't need a perfect start. You need a better strategy and the discipline to execute it.

Dividend Income — 2004 to Present

Updated May 2026
Annual Income (2020)
~$950
Annual Income (2026)
~$1,600+
Current Trajectory
↑ Accelerating
Account B dividend income chart 2004 to 2026 showing consistent TGI growth

The dip around 2021–2022 is the TGI cleanup — approximately $5,300 in bottom-ranked holdings were sold and redeployed into top-ranked TGI stocks in July 2021. Dividend income dropped as the higher-yielding junk came out and lower-yielding growth stocks came in. The revenue recovered quickly and is now well above where it was before the reset.

The Annual Average All line (dark green) shows the long arc clearly. What took years to build under the previous approach has been substantially exceeded in under four years of TGI discipline. Annual dividend income is now approaching $1,600 and the slope is still steepening.

Portfolio Balance — 2016 to Present

Updated May 2026
Balance (Early 2020)
~$15,000
Current Balance
~$175,000
Growth Since 2020
10× in 6 years
Account B portfolio balance chart 2016 to 2026 showing explosive TGI growth

This chart is the one that speaks loudest. Near zero in 2016. Slow and patient through 2022. Then a compounding curve that has taken the portfolio from $30,000 to nearly $175,000 in roughly four years — without panic, without trading, without shortcuts.

This is what consistent TGI buying looks like when it has enough time and enough quality stocks to work with. Every paycheck deployed into the top-ranked names. Every dividend reinvested. The math does the rest.


This portfolio wasn't built from a desk with time to research. It was built during a punishing commute across Southern California — managed on a phone, orders set before bed, positions reviewed between shifts. The investor discovered the TGI ranking scores in 2021 and built a concentrated growth system around the union of the TGI and PGI Top 100 — stocks that rank highly for both total growth and pure price performance. Technical analysis was layered on top to guide entry timing and position sizing. An AI assistant was added later to help interpret charts and maintain decision discipline between sessions.

The mandate is clear and unambiguous: grow to a specific dollar target by a specific age. Every decision is evaluated against that single objective. Drawdowns are accepted. Concentration is intentional. Diversification is a secondary concern to capital efficiency. This is a different application of the ranking methodology than Accounts A or B — more aggressive, more concentrated, and deliberately so.

Portfolio Return % vs S&P 500 — 2022 to Present

Updated May 2026
Since Jan 2020
+564.10%
S&P 500 Same Period
+127.97%
Outperformance
~3× the index
YTD 2026
+36.6% vs +6.0%
Account C portfolio return vs S&P 500 from 2022 to 2026

The chart shows quarterly return percentages relative to a January 2022 baseline. Both lines drop sharply into 2022 — this portfolio took the full force of that downturn alongside the broader market. That honest data point matters. Concentration amplifies both gains and losses, and the 2022 drawdown is real.

What follows is the separation. From mid-2023 onward the gap between this portfolio and the S&P 500 widens consistently, driven by concentrated positions in AI infrastructure, electrification, semiconductors, and power — sectors the PGI and TGI ranking scores had been surfacing for years before the broader market narrative caught up. The ranking methodology found these stocks. Discipline kept them.

A few honest observations

The reset costs income, not wealth

Account A's dividend income dropped 90% in 2020. But the portfolio value barely flinched. Switching from high-yield to TGI is painful in the income column — and it's the right move anyway. The long game is portfolio value and dividend growth, not just current yield.

Earlier is better — but later works too

Account B started earlier and avoided the high-yield detour. Account A started earlier but spent 20 years on wrong paths. Both are now compounding steeply. The best time to start was yesterday. The second best time is today.

The inflection point is real

Both portfolio charts show the same pattern: years of modest growth, then a curve that suddenly steepens. This is compounding becoming visible. It doesn't happen immediately — but it does happen. Patience and discipline are the inputs. This is the output.

These are still climbing

Neither portfolio is at its destination. Both are mid-climb. The charts are shared not to show a finished product but to show a strategy working in real time, through real market conditions, with real capital on the line. The summit is still ahead.

Concentration is a choice, not a mistake

Account C runs a deliberately concentrated portfolio — roughly 30 positions, with significant weight in a handful of high-conviction names. The ranking scores define the universe. Discipline defines the execution. This approach carries more volatility than Accounts A or B, and accepts that trade-off explicitly. Different goals require different tools. The methodology adapts.

Ready to understand the strategy behind the results?

The methodology is open source. The tools are free. The work is yours.

How TGI Works Explore the Tools Read the Book